 views
views
TABLE OF CONTENTS
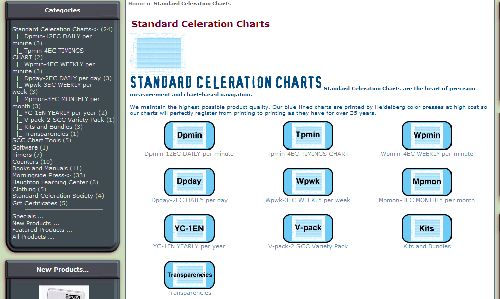
Image of a Standard Celeration Chart (SCC)
Click image to enlarge: Low resolution scan of Daily per minute Standard Celeration Chart facsimile
Top
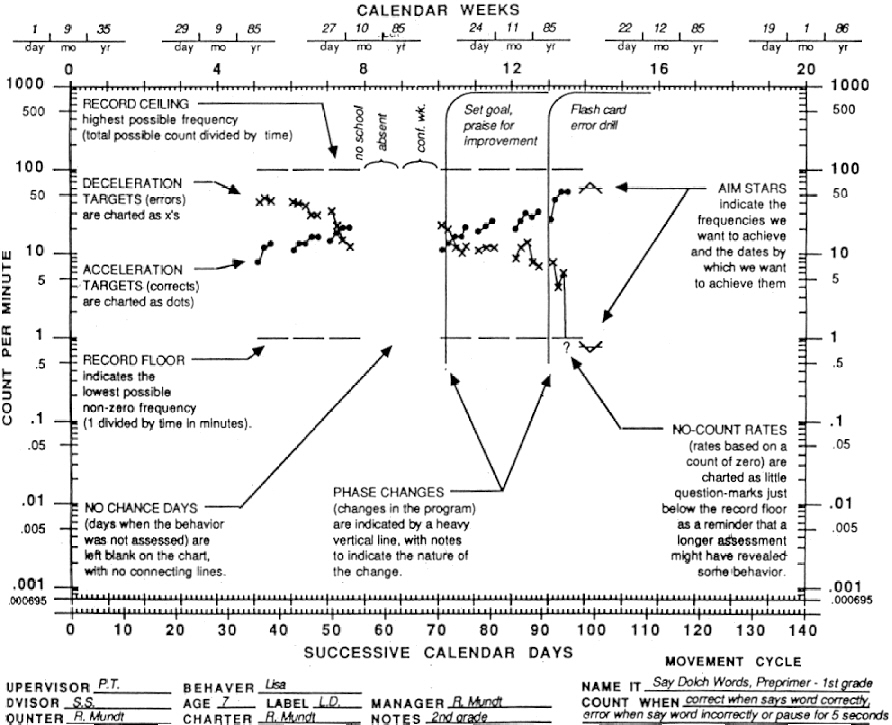
Representation of a chart with important elements highlighted.
Click image to enlarge

Top
Q: What's the Standard Celeration Chart?
A: For a description of the history of Precision Teaching and the rationale for the use of the Standard Celeration Chart,
see this page from Athabasca University, Psych 387.
and this fairly easy to read article,
Calkin, A.B. (2005).Precision Teaching: The Standard Celeration Charts. The Behavior Analyst Today, 6, 207-213.
Top
Q: Where can I get Standard Celeration Charts?
A: To get the original standard, from the founder and source, visit Behavior Research Co..
There are also alternative and computer versions of the (Daily count per minute) chart.
See THIS PAGE for sources.
Top
Q: Is there only one kind of chart?
A: No, although in regular teaching the Tpmin-4EC Timings Chart, and the Dpmin-12EC , Daily count per minute chart, are the two most commonly used; other daily, weekly, monthly and yearly charts are also used.
It might come as a surprise that celeration charts come in many different versions depending on the frequency measurement of interest over a given period.
Here are the versions available from Behavior Research Co.
 on each linked page below will give you a detailed zoom of the chart.
Tpmin-4EC Timings Chart--to measure multiple timings in a teaching session. Can also be used to record counts per minute across groups of 10 successive minutes. There are 10-10 minute blocks. In usual practice, either the first, median or best timing for the session or day is transferred to the Dpmin-12EC DAILY per minute chart.
Dpmin-12EC DAILY per minute chart--the benchmark chart, and the one that is most used and familiar. Originally the "Standard Behavior Chart". Frequencies are recorded in frequencies per MINUTE on a DAILY basis. 140 calendar days.
Dpday-2EC DAILY per day. For recording frequencies per DAY, vs. per minute. 140 calendar days.
Wpmin-4EC WEEKLY per minute. For recording frequencies per minute per WEEK. 100 calendar weeks.
Wpwk-3EC WEEKLY per week. For recording frequencies per WEEK per week. 100 calendar weeks.
Mpmin-EC MONTHLY per minute. (6/13/09 No longer available) For recording counts per minute over 120 calendar months/10 calendar years.
Mpmon-3EC MONTHLY per month--Count per month over 120 calendar months/10 calendar years.
YC-1EN YEARLY per year. Counts per year. 10 calendar decades/100 calendar years.
There are also options of modifying commercial charts for specific uses; for example, to modify the monthly per mont h Standard Celeration Chart to create Hourly, Minutely or Secondly Standard Celeration Charts.
Top
Q: Is the chart hard to use?
A: No...really.
Someone suggested using the slogan "simple enough for a caveman" (but that's been taken), but it certainly is simple enough so that a CHILD can learn to chart his or her own progress;

One example is the Behavior Research Company slideshow "Charting rates with Stephanie Bates", where 5 year old Stephanie Bates demonstrates how to use a Standard Celeration Chart.
In fact, in many situations, it has been shown that student charting results in improved performance without making any other change, because it gives the learner an interest in his or her own progress and a visual yardstick to compare by.
Top
Articles:
[NB--add articles to this list]
Cancio, E.J., & Maloney, M. (1994) Teaching students how to proficiently utilize the Standard Celeration Chart. Journal of Precision Teaching, 12, 15-30.
ABSTRACT:
Precision Teaching has complemented other instructional methods with some of the most powerful applications combining Precision Teaching and Direct Instruction. A 1982 article in this Journal by the second author described a Direct Instruction program to teach students to proficiently chart the Standard Celeration Chart. Further development of the Direct Instruction program, including procedures and actual lesson plans, is presented below.
Cancio, E.J., & Maloney, M (1994). Teaching peer-tutors how to proficiently utilize the Standard Celeration Chart: A field test. Journal of Precision Teaching, 12, 8-14.
ABSTRACT:
Over the last 14 years students with varying levels of age and ability have been taught by a Direct Instruction procedure to
chart the Standard Celeration Chart. Lesson plans for learning the Chart have been modified to accommodate developments in
data-based decision making. Three peer tutors in a regular middle school were trained to use the Chart in a special education classroom serving students with autism and severe mental retardation. All peer tutors mastered charting after completion of the lesson plans!
Other papers in the Journal of Precision Teaching, and Journal of Precision Teaching and Celeration
Top
Q: How do I use it? Where can I learn?
A: See the MUST-HAVE TEXTS, but there are also some online resources for getting started:

Print out a facsimile chart to look at and practice with.
(Standard Celeration Charts of many different types can be purchased at Behavior Research Co..)
Then read,

Tutorial of Celeration Charting
Author: Dr. Rick Kubina, Ph.D, Associate Professor of Education at Penn State University;
from his website, Precision Teaching and Standard Celeration Charting
Also see,

The Standard Celeration Chart:
An overview of its features and conventions (aka, The Chartbook)
and

The Finder Book for the Standard Celeration Chart.
scroll to the bottom of the page.
This manual describes use of the Frequency Finder with a standard celeration chart.
Author: Dr. Owen White, Ph.D., University of Washington.
Files prepared for
EDSPE 510: Classroom Measurement and Management
Top
Q: What's the "Calendar Synchronization date" and...why?
A: Chart synchronization helps to simplify,
-
References to weeks, rather than searching a chart for a date.
-
Direct comparisons to different skills and different students, even in different locations, in the same week and on the same day. Hypothetically and for example, if all charters adhered to the original calendar synchronization date convention, charters in California, Iowa, Japan, and Australia could be able to directly compare their charts without recharting or translation of the day that data was taken.
The chart-convention is that
Chart 1
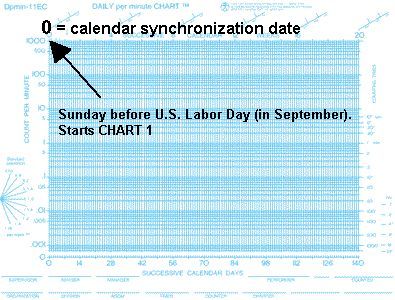
The first chart of the academic year starts on
the Sunday of the week of U.S. Labor Day.
Example: For 2009 - 2010
Chart 1 starts Sunday 6 SEP 2009 (Sunday before U.S. Labor Day)
Chart 2: Sunday 24 JAN 2010
Chart 3: Sunday 13 JUN 2010

The second chart begins 20 weeks after the first chart start date.
Traditionally that runs through the end of the academic year.
Example: For 2009 - 2010
Chart 1 starts Sunday 6 SEP 2009 (Sunday before U.S. Labor Day)
Chart 2: Sunday 24 JAN 2010
Chart 3: Sunday 13 JUN 2010

The third chart begins 20 weeks after the second chart start date,
and runs through summer.
Example: For 2009 - 2010
Chart 1 starts Sunday 6 SEP 2009 (Sunday before U.S. Labor Day)
Chart 2: Sunday 24 JAN 2010
Chart 3: Sunday 13 JUN 2010
The following year the process begins anew on the Sunday of the week of the U.S. Labor day, and so on.
To download a synchronization calendar through 2023 (pdf)
.
A backup site to check calendars--
internet perennial calendar
Calendar Synchronization Dates 1965-2006
--this file was requested for folks who might want to rechart old research data.
For more details, see discussion of SCC calendar lock-in date by Malcolm Neely, Ed.D. from the SCListserv 9/9/2000.
Top
Q: Are there any examples that I can look at?
A: Yes!

See the posted charts at Ben Bronz Academy/The Learning Incentive
Charts shared from 1999-2001
and

To see a variety of Precision Teaching and charting examples specific or relevant to children
on the autism spectrum look at Organization for Research and Learning formerly Fabrizio-Moors Consulting:
Professional Work Examples

Charting Results So We Can Understand and Communicate Them
Carl Binder, Presentation, International Society for Performance Improvement (ISPI) 2004
Top
For More Detailed and Advanced Topics
For other more technical FAQs of the Standard Celeration Chart see:
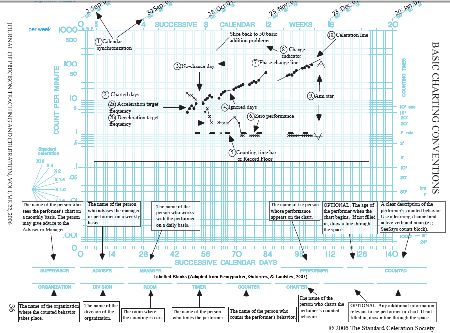
Basic and Advanced Charting Conventions of the Standard Celeration Chart
Copyright 2006, The Standard Celeration Society
This is a guide to conventions especially for those submitting manuscripts to the Journal of Precision Teaching and Celeration, but is also a helpful mini-tutorial to those who want a guide to the protocols and standards of using a Standard Celeration Chart.

Standard Celeration Chart Topics.
Website authored by John W. Eshleman, Ed.D., BCBA
This is a rebuild of his original site that was formerly at the now inactive address
http://members.aol.com/standardcharter/index.shtml

The FAQ page of the Standard Celeration Society;Standard Celeration Charting Q & A
History of the Chart and other notes from Potts, Eshleman, & Cooper [Poster, IPTC Park City, UT 1992]
Narrative specific to the Standard Celeration Chart, from
Historical Antecedents of Precision Teaching
Lisa Potts, John W. Eshleman, John O. Cooper
The Ohio State University
Poster presented at the Tenth Annual International Precision Teaching Conference,
March 25-28, 1992, held at Park City, UT. Conference
Theme: "An Educational Summit: Establishing America's Agenda
For Accountability."
Development of the Standard Celeration Chart:
1. Development team: Ogden Lindsley, Eric Haughton, several graduate students, Sandy Houston (administrative assistant) & Helen Brennan (printer).
2. Size of the chart: Designed to fit on an overhead projector & computer screens.
Landscape view adopted instead of portrait view.
3. Chart paper must be durable: At least 6 months. First printed on Kodak paper -- lasted only 2 months with daily charting. Next, printed on an imported cotton paper from Denmark--available for only a short time. Currently use Eagle Translucent A paper -- the most durable paper made in the United States.
[Note 2009 RGCF: This paper may no longer be in production; Behavior Research Company would have information on type of paper stock currently used]
4. Chart color: Red (example of one of the "test charts"), orange, yellow, green, blue, and light brown were tested. Color preference was a shade of green. But the light blue chart produced the highest accuracy and was more resistant to fatigue.
5. A six cycle chart [.001-.01-.1-1-10-100-1000 (counts per minute)] contains a sufficient range of frequencies for human behavior (in a day).
6. Calendar days changed from a calendar year to 20 weeks. A factor: The angle from the lower left corner to the upper right corner of the chart controlled the number of days. This angle must show a doubling in weekly celeration.
[Note 2009 RGCF: An Excel-based version of a celeration chart that is able to display a calendar year on a single chart is The One Year "TOY" Standard Celeration Chart, Steve Graf, PhD., Jack Auman, M.A., Ogden Lindsley, PhD.. Graf Implements, Poland, OH November 2007; available from Behavior Research Co.
To see an early test version of a chart with x-axis/across the bottom displaying 200 days]
Top
Technological Developments:
1. The Standard Celeration Chart with standard slopes.
Derived from cumulative record. (The cumulative record was a standard frequency chart).
X2 celeration= 34 degrees.
Top
Standard Behavior Chart (1965).
Now named the Standard Celeration Chart. The chart evolved from Skinner's cumulative record (which is a standard frequency chart). Both charts have standard slopes. Both charts display major changes in behavior (e.g., doublings, triplings, quadruplings, etc.).
Top
DISCLAIMER: The information on this site is presented on an "as is" basis, and does not claim to present definitive information, make recommendation or to represent such official bodies such as the Standard Celeration Society. Users of this site agree that the owner of the site or authors of pages and articles are indemnified against legal liability
Fair Use Clause
These pages may contain copyrighted (© ) material and is made available under the "fair use" clause for purposes such as criticism, comment, news reporting, teaching, scholarship, or research, etc. In accordance with Title 17 U.S.C. Section 107, this material is distributed without profit to those who have expressed a prior general interest in receiving similar information for research and educational purposes. For more information go to: http://www.law.cornell.edu/uscode/17/107.shtml. If you wish to use copyrighted material for purposes of your own that go beyond 'fair use', you must obtain permission from the copyright owner.
2/8/08


Comments (0)
You don't have permission to comment on this page.